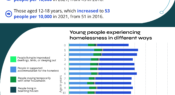
Many students face personal challenges and hardship outside the school grounds, and this can have a negative impact on their health and education. Data published in 2023 explores 2021 Census data to give insight into the estimated number of people experiencing homelessness. Here, we share some of the data relating to those under the age of 18.
Understanding the key concerns of your school staff can help inform professional development and supports provided. A recent survey asked teachers working in preschool to year 12 settings to share how often they worry about COVID-19 and other extreme events, such as natural disasters and critical incidents.
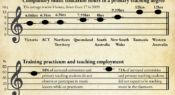
The new Fading Notes report explores the provision of music education in Australian primary teaching degrees. Researchers surveyed lecturers responsible for music education within Initial Teacher Education degrees, representing a student pool of more than 4,600 primary teaching students across 73% of universities delivering generalist primary teaching degrees. Topics included music training hours, and knowledge, skills and competency to teach. Here are some of the results.
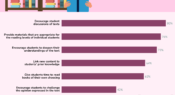
Recently released survey data from PIRLS 2021 (Progress in International Reading and Literacy Study) includes information on reading instruction strategies used in year 4 lessons. This infographic shows the percentage of Australian PIRLS 2021 students whose teachers reported using these strategies in every or almost every lesson.
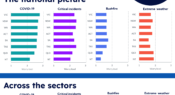
The new report, Progress in International Reading Literacy Study: Australia’s results from PIRLS 2021, reveals how the average reading performance of year 4 students in Australia compares to other countries. Find out more in today’s infographic.
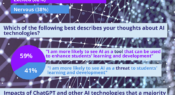
A new report from McCrindle outlines 7 disruptors impacting the future of education, informed by survey data. One identified disruptor is artificial intelligence and technological change. In this infographic, we share some of the survey results for questions on artificial intelligence and technological change.
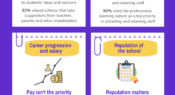
The Australian School Education Leaders Sentiment Index, by Slade Group, explores the priorities and drivers for school leaders when considering a new role. It draws on findings from interviews and a survey with 60 principals, from which 5 key themes emerged. Find out more in our latest infographic.
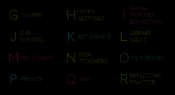
What do you need information on? Behaviour strategies? Embedding First Nations perspectives? Student engagement? Reflective practice? The 11th Teacher alphabet brings you quick links to popular content that you might find useful. Download the PDF for a hyperlinked version.
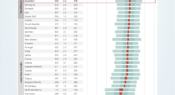
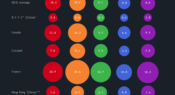
The new country report Education Policy Outlook in Australia has highlighted the fact that 'The disciplinary climate in schools in Australia was among the least favourable in the OECD according to students' reports in PISA 2018'. In this infographic we take a look at those PISA survey statistics, and how Australia compares with 11 other countries.
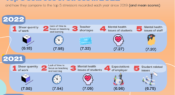
The 12th annual Australian Principal Occupational Health, Safety and Wellbeing Survey shows school leaders are under increasing pressure and stress. Here we share some key insights from the latest (2022) report, and how the top 5 sources of stress for school leaders have evolved over time.
Facebook
Twitter
YouTube
SoundCloud
Apple Podcasts
Spotify
RSS feed